Bullish Breakout Confirmed – Focus Shifts to $4,050 and $4,840 Targets
Ethereum (ETH/USDT)
Date of Analysis: July 18, 2025
Chart Timeframe: 1D (Daily)
Source: Vancelian Technical Research
Strategic Scenario (6 to 12 months):
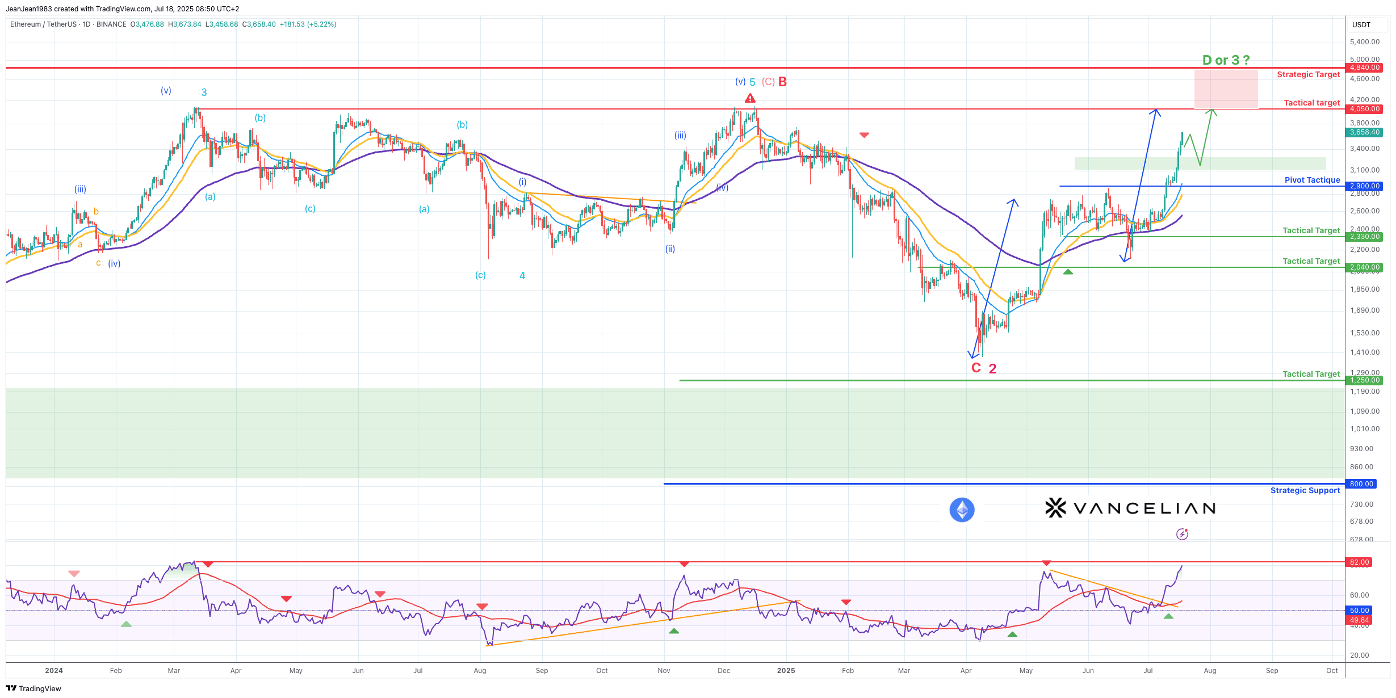
Ethereum remains within a broad long-term corrective range between $800 and $4,840. The confirmation of the C2 bottom and the impulsive breakout above $3,180 reinforce the scenario of a bullish resumption.
With the current breakout now fully validated, ETH is positioned for a potential extension toward the $4,050 intermediate strategic target and the $4,840 zone, which coincides with potential wave D or 3. The maximum potential stands at $7,750 in case of weekly breakout $4,840
🔸 Tactical Scenario (1 to 3 months):
The breakout above $3,180 has confirmed the continuation of the bullish impulsive structure initiated from the C2 bottom. Price is now progressing toward the $4,050 tactical target.
A short-term consolidation may occur between $3,660 and $3,300, but as long as the $2,900 pivot holds, pullbacks are considered opportunities to add long exposure.
An extended move toward $4,840 remains valid in the event of favorable macro/crypto momentum and sustained strength in BTC and ETH.
Alternative Scenario:
If Ethereum fails to hold the $2,900 tactical pivot (confirmed daily close below), bearish momentum may re-emerge.
This would open the path to retest previous support zones:
First tactical supports: $2,330, and $2,040
Broader corrective zone: $1,250–$1,200 in case of deeper macro deterioration
Technical Key Elements:
RSI: Bullish, with no divergence — continued upward momentum
Moving Averages: Price above 20, 50, and 100 EMA (positive structure)
Fib Levels:
Tactical target: $4,050 (61.8%)
Strategic target: $4,840 (78.6%)
New tactical pivot: $2,900
Elliott Wave Structure:
Wave C2 completed
Potential Wave 3 in development (or Wave 1 of a new cycle)
Trade Idea Conclusion:
Buy Strategy
Long exposure justified above $3,180, confirmed on daily close
Add on pullback around $3,300–$3,000, stop-loss below $2,900
Target 1: $4,050
Target 2 (extension): $4,840
Trailing stop advised once price crosses $3,800
Chart: Daily Basis (Candle Stick) - Logarithmic
Indicators: Exponential Moving average (21/34/89) - RSI (21)

Disclaimer: The content of this analysis should not be considered as a study, an investment advice or a recommendation concerning products, strategies or a particular investment opportunity. This content is strictly for illustrative, educational or informational purposes and is subject to change. Investors should not base their investment decision on the content of this site and are strongly recommended to seek independent financial advice for any investment they are considering.