Aktio close to key tactical support at 0,12
Analysis of the Chart for: Aktio Coin – AKTIO/USDC (BITMART)
Date of Analysis: July 16, 2025
Chart Timeframe: 1-Day (Daily)
Strategic Horizon Analysis (6 to 12 months)
Aktio Coin (Vancelian native token) remains in a broader long-term accumulation range phase, recovering from a historical bottom structure formed in Q1 2025.
The strategic structure is defined by a potential large-scale reversal pattern with strategic resistance seen near $0.2490–$0.3170, aligned with prior seller distribution zones. The long-term bullish targets remain valid as long as price structure holds above the critical demand cluster near $0.0800.
⚠️ Important Context: Aktio Coin remains a low-cap token, which implies that volatility remains high on both the buy and sell side due to lower market liquidity. A sustained breakout and consolidation above $0.3170 is considered critical to attract sufficient liquidity in the order book and initiate a constructive bullish trend.
This would be a key milestone in enabling the asset to gradually aim toward its ICO introduction price of $1.00, marking a significant strategic threshold for long-term holders.
Tactical Horizon Analysis (1 to 3 months)
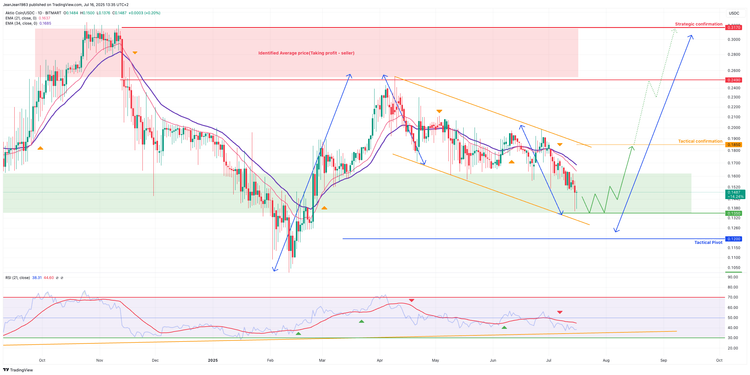
Aktio Coin is currently correcting within a descending channel, approaching key Tactical Support around $0.1200, which aligns with previous consolidation zones and the defined Tactical Pivot. A daily close above $0.1200 is essential to preserve bullish potential. This zone may serve as a springboard for a rebound toward $0.1850, with a further move to $0.2490 contingent upon a confirmed daily close above $0.1850.
Short-term price structure remains bearish, marked by a sequence of lower highs and lower lows. The RSI is still below the 50% line, maintaining a bearish momentum profile, while the EMA 21/34 continue to show a downward crossover and declining slope.
However, a long-term bullish trendline is developing near the RSI levels — a technical structure that hints at the potential for a renewed upside swing. A rebound from this RSI trendline, if synchronized with price stabilization and breakout above tactical resistance, could serve as a leading indicator of a reversal.
🔎 Cross-Horizon Signal:
This tactical configuration should not be read in isolation. It coincides with accumulation signals on the strategic horizon, including price structure compression, long-term volume absorption, and repeated support tests. Together, these overlapping technical elements reflect a growing psychological interest among strategic investors in Aktio Coin. This behavioral footprint suggests that a breakout above key resistance could trigger a sentiment shift and accelerate upside positioning.
![]()
Alternative Tactical Scenario
A confirmed daily close below $0.1208 (Tactical Pivot) would invalidate the potential bullish rebound and open the path for a deeper correction toward $0.1020 and possibly $0.0980, aligning with previous major accumulation levels.
Conversely, a breakout above $0.1850 would shift the momentum back in favor of bulls, targeting $0.2490, which coincides with a known profit-taking zone.
![]()
Technical Key Elements
RSI (21): Bearish to neutral – Currently at 36.75, below 50%, but close to significant support
Moving Averages (EMA 21/34): Bearish crossover, with price trading below both MAs.
Fibonacci Levels: Tactical support near $0.120, resistance near $0.2490–$0.3170.
Elliot Wave: Likely in a complex Wave 2 or Wave B correction within a broader bullish cycle.
![]()
Tactical Trade Recommendations
Buy Strategy:
Consider long positions only if price confirms a bullish reversal pattern from $0.1300–$0.12000 with RSI divergence or daily close above the short-term descending channel.
Target: $0.1850 → $0.2490
Stop-Loss: Close below $0.120
Caution : Accumulating a significant position at low prices in anticipation of long-term gains is a high-risk strategy. Without broad adoption or increased trading activity, this approach can lead to strong asymmetry in outcomes. In the absence of liquidity, any urgent need to exit the position could result in severe price dislocation, potentially forcing sales into thin order books and amplifying downside slippage. Investors should weigh this risk profile carefully against the potential upside.
Chart: Daily Basis (Candle Stick) - Logarithmic
Indicators: Exponential Moving Average (21/34/89) - RSI (21) 

Disclaimer: The content of this analysis should not be considered as a study, an investment advice or a recommendation concerning products, strategies or a particular investment opportunity. This content is strictly for illustrative, educational or informational purposes and is subject to change. Investors should not base their investment decision on the content of this site and are strongly recommended to seek independent financial advice for any investment they are considering.