BTC at key support after having completed consolidation pattern. Watch 90,000$/94,000$ as key support for direct recovery.
Bitcoin (BTC/USDC)
Date of Analysis: November 14, 2025
Chart Timeframe: Daily
Strategic Scenario (6 to 12 months)
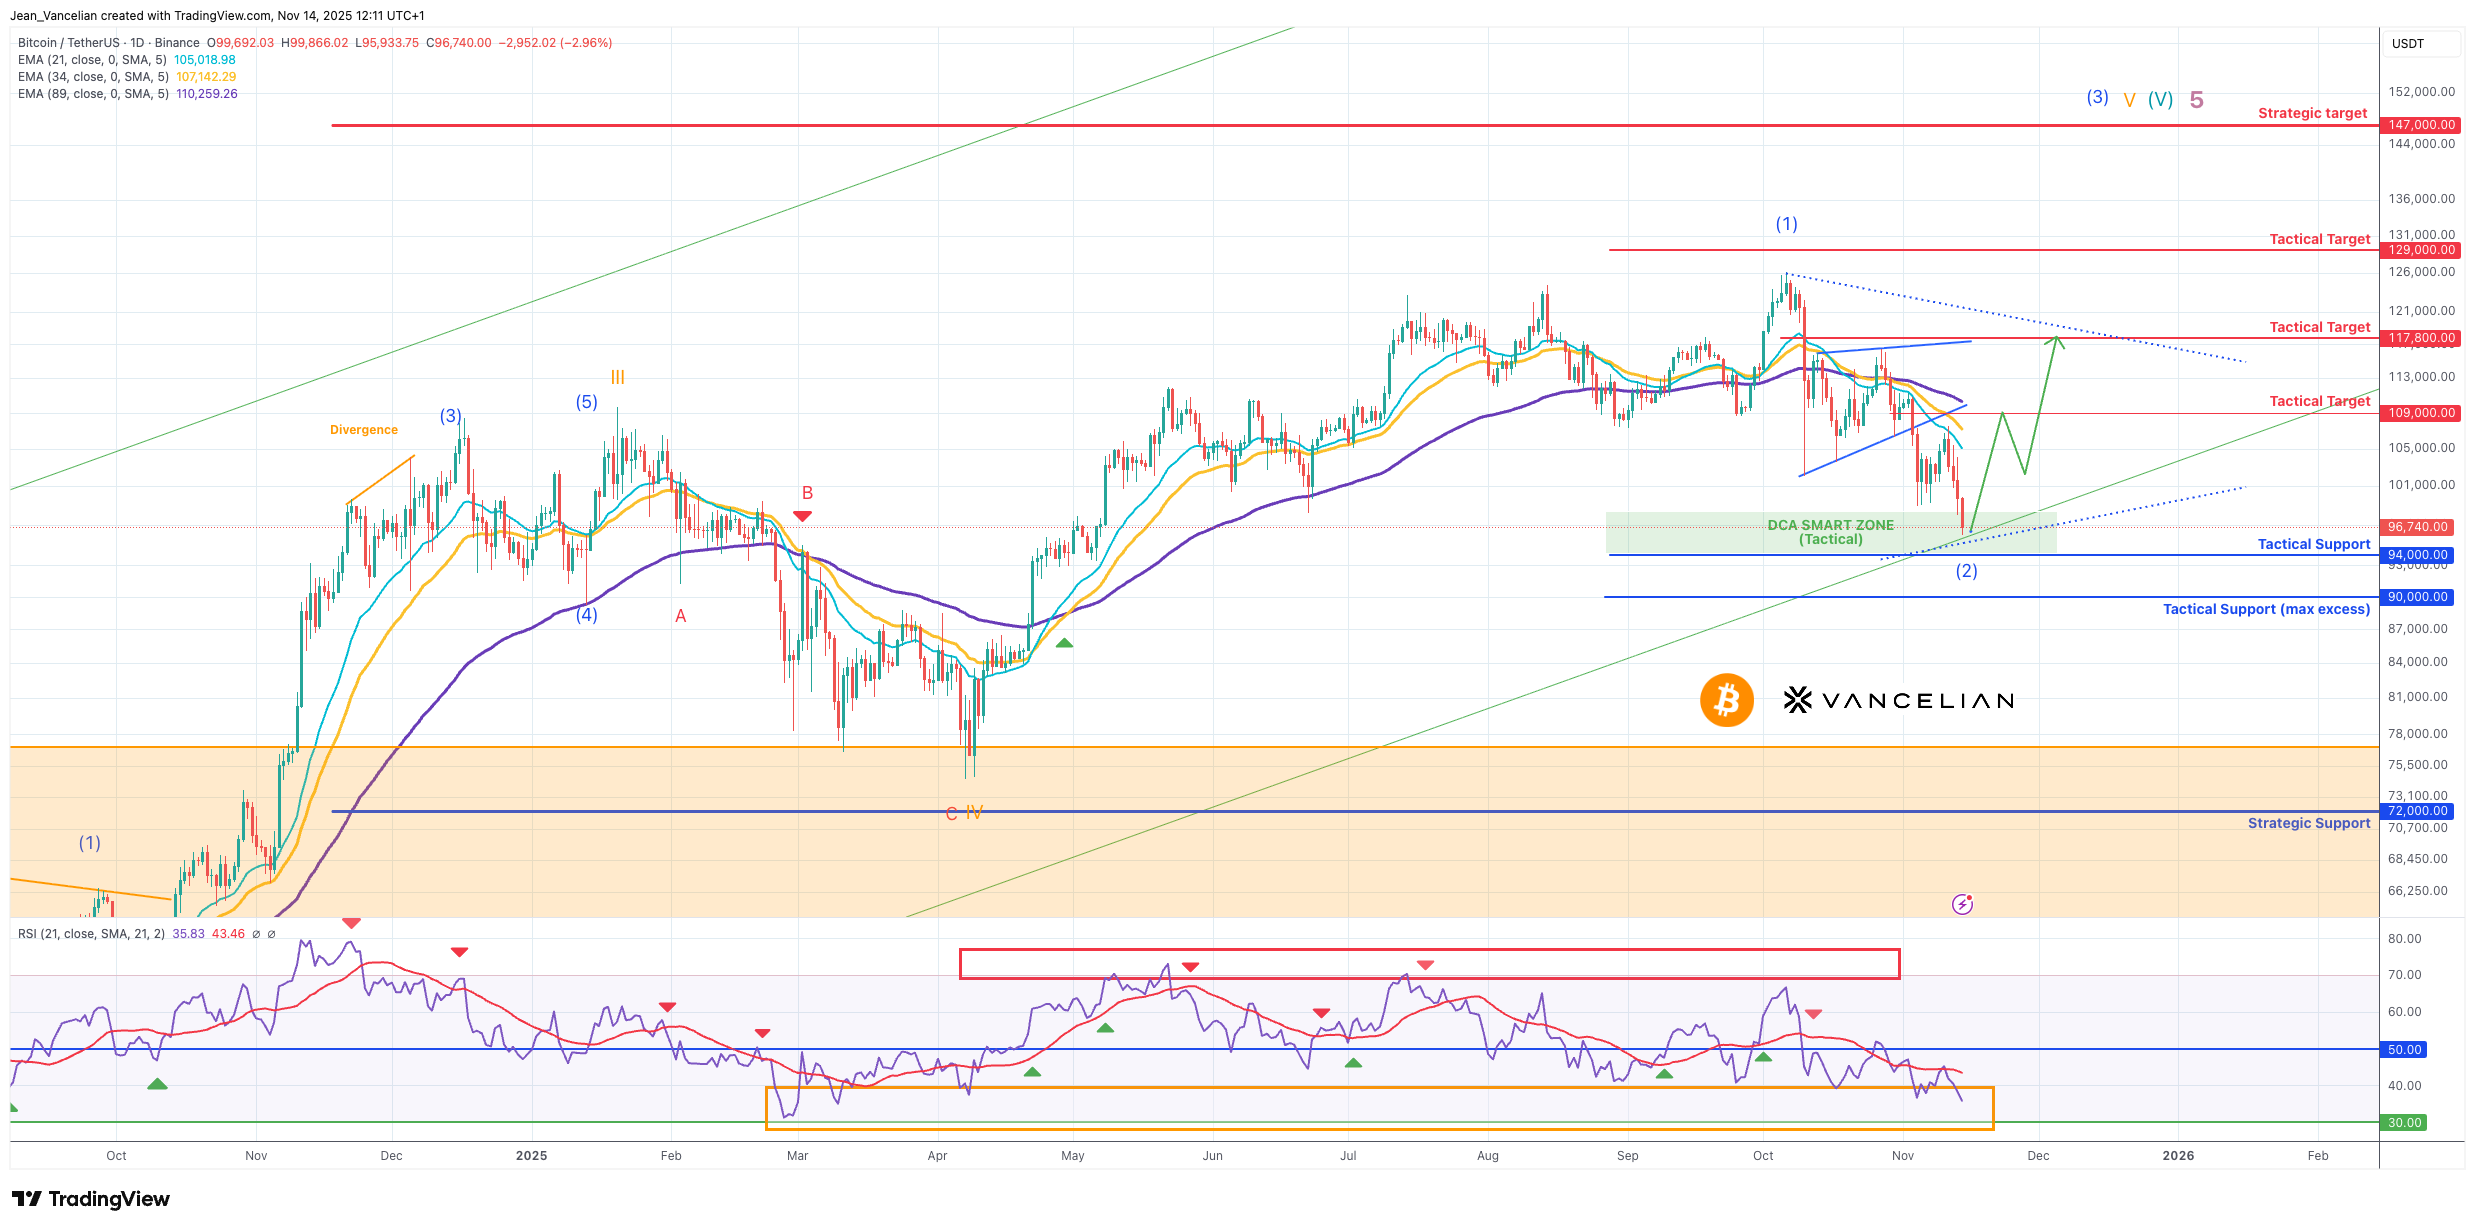
Bitcoin has confirmed the end of corrective Wave IV and is currently developing Wave V with strong bullish momentum. As long as the strategic support at $72,000 (Updated) holds, the long-term bullish trend remains valid, with targets at $140,000 and $147,500.
Key Observation:
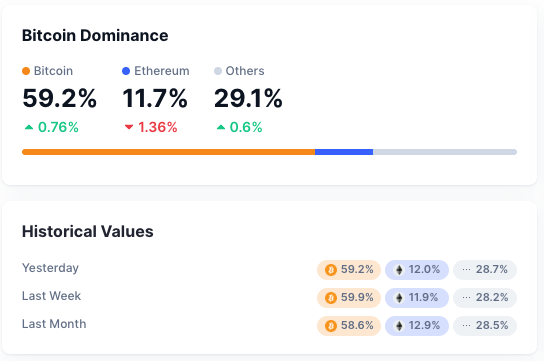
The dominance of Bitcoin has surged to 64% prior to 63,1% in May 2025 (11/07/2025 - source coinmarketcap) of the total crypto market capitalization since November 2024, marking its highest level since 2021. This confirms Bitcoin’s outperformance relative to the broader crypto market, a trend that remains strongly active and further reinforces long-term bullish sentiment.
Tactical Scenario in progress (1 to 3 months)
BTC was trading within a consolidation pattern since october pushing back the asset towards its major tactical support level and tactical key elements.
Momentum was turning bearish on the short-term run after the black Friday liquidity krash (11-10-2025) with RSI progressing below 50% and no divergence. Today the configuration has changed with potential RSI divergence on going close to key technical elements acting as support around 94,000$ and 90,000$, we do expect a larger recovery to take place with 109,000$ and 117,800$ as first tactical target to watch.
Alternative Scenario
A failure to confirm belo $94,000 followed by a break below $90,000, could trigger a retracement to $72,000, without invalidating the broader bullish structure but with a larger consolidation towards the strategic key support level.
Technical Key Elements
· RSI: close to support
· Moving Averages: EMA 21/34/89 trending downwards.
· Key Supports: $94,000 (Tactical DCA) & $72,000 (strategic).
· Breakout Confirmation Level: $117,800
· Elliott Wave: Wave V in progress, likely in sub-wave (3) V.
Tactical Trade Plan
Buy Strategy: Buy the dip below 100,000$
Targets: $117,800 and $147,500
Stop-Loss: Daily close below $90,000$
Chart: Daily Basis (Candle Stick) - Logarithmic Indicators: Exponential Moving Average (21/34/89) - RSI (21)
Disclaimer: The content of this analysis should not be considered as a study, an investment advice or a recommendation concerning products, strategies or a particular investment opportunity. This content is strictly for illustrative, educational or informational purposes and is subject to change. Investors should not base their investment decision on the content of this site and are strongly recommended to seek independent financial advice for any investment they are considering.