BTC in a Decision Phase: Reclaiming the Underlying Trend or Entering a Prolonged Consolidation?
BTC progressing into a deeper consolidation phase – $72,000 remains the key strategic support
Bitcoin (BTC/USDC)
Date of Analysis: December 09, 2026
Chart Timeframe: Daily
Strategic Scenario (6 to 12 months)
Bitcoin has seen a significant shift in momentum since October, followed by a relatively negative month of November. This period has been amplified by the short-term U.S. government shutdown, which has weighed on investor confidence and blurred market visibility.
At the same time, Bitcoin has recently decoupled from gold, while showing increased sensitivity to risk-on assets such as the Nasdaq. This raises questions about the current liquidity profile supporting the crypto market.
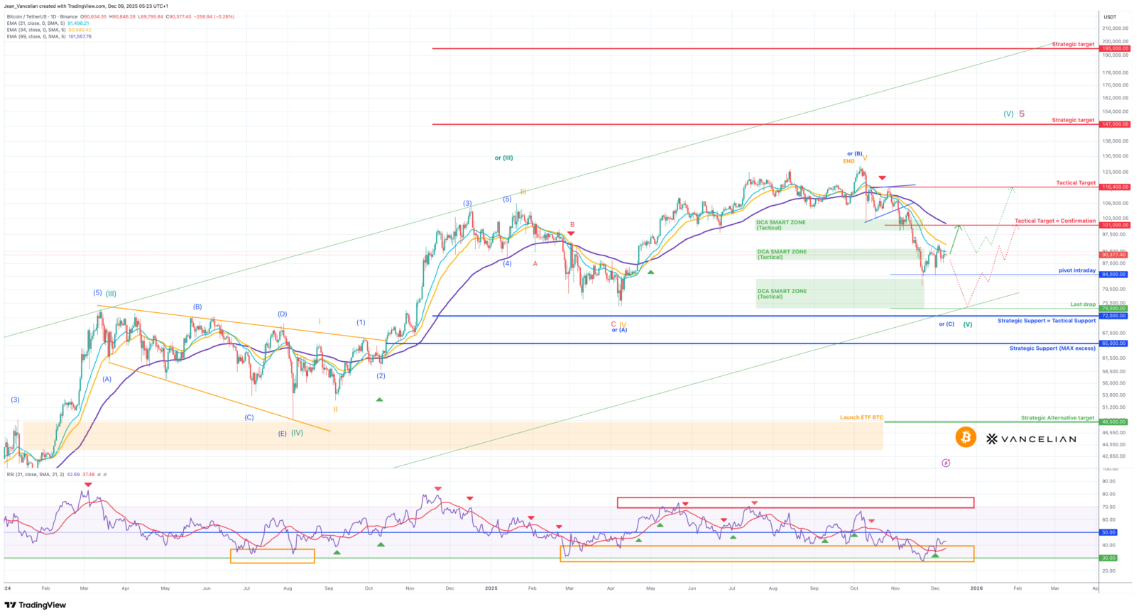
The Elliott Wave structure currently presents two remaining paths. Current wave counts suggest that an irregular Wave IV is still unfolding, with a potential completion zone expected between $82,000 and $77,000, before the initiation of Wave V to the upside.
Alternatively, a confirmed break below the strategic $72,000 support would invalidate the long-term cycle and open the door to a deeper corrective phase, with $48,500 as the first major target.
Despite this, the long-term structure remains unchanged: $72,000* continues to act as the key strategic support. A rapid recovery above $101,000 would be required to limit a deeper downside risk and confirm the reactivation of bullish momentum.
*($65,000 defined as inside session max excess)
As long as the $72,000 support level holds, the long-term bullish trend remains intact, with medium-term targets at $140,000 and $147,500.
Key Observation
Bitcoin’s dominance has risen to 64% (vs. 63.1% in May 2025), as of 11 July 2025 (source: CoinMarketCap), representing its highest share of total crypto market capitalization since November 2024. Over the same period, the Altseason Index reached –78%, its lowest level since 2021.
This dynamic confirms Bitcoin’s continued outperformance relative to the broader crypto market—a trend driven by the fundamental singularity of the Bitcoin whitepaper and its capacity to preserve a reserve-value function, thereby absorbing and retaining market liquidity.
|
|


Tactical Scenario in Progress (1 to 3 months)
Bitcoin has failed twice to reactivate the bullish momentum initiated earlier in October. The first two DCA zones identified on the chart illustrate early accumulation attempts, both of which were absorbed without generating a sustained recovery. Since our last analysis, the configuration has shown a tentative rebound, reaching the initial target at $92,700, which had a high probability of materialisation due to specific technical factors.
The coming days will be particularly important for Bitcoin and for the broader crypto market, as a reclaim of the $101,000 level is essential to distance the asset from high-risk bearish scenarios.
At this stage, all technical signals remain skewed to the downside:
- The RSI remains in negative territory, with no confirmed bullish divergence, although a tentative re-entry into the positive zone is underway.
- Moving averages have crossed downward and continue to accelerate lower.
- The $101,000 area now acts as a strong dynamic resistance.
As long as the strategic and tactical $72,000 support holds, we expect a continued recovery attempt, with $101,000 acting as the key tactical confirmation level neded to reduce broader downside risks and unlock a potential move toward $116,400
Chart: Daily Basis (Candle Stick) - Logarithmic
Indicators: Exponential Moving Average (21/34/89) - RSI (21)