Former bullish scenario invalidated – Technical signals turn bearish, calling for caution on ETH
Ethereum (ETH/USDC)
Date of Analysis: November 22, 2025
Chart Timeframe: Daily
Strategic Scenario (6 to 12 months)
Ethereum has experienced a notable shift in momentum since October, followed by a clearly negative month of November. This deterioration has been reinforced by the short-lived U.S. government shutdown, which weighed on investor confidence and further blurred visibility on risk-on assets such as cryptocurrencies.
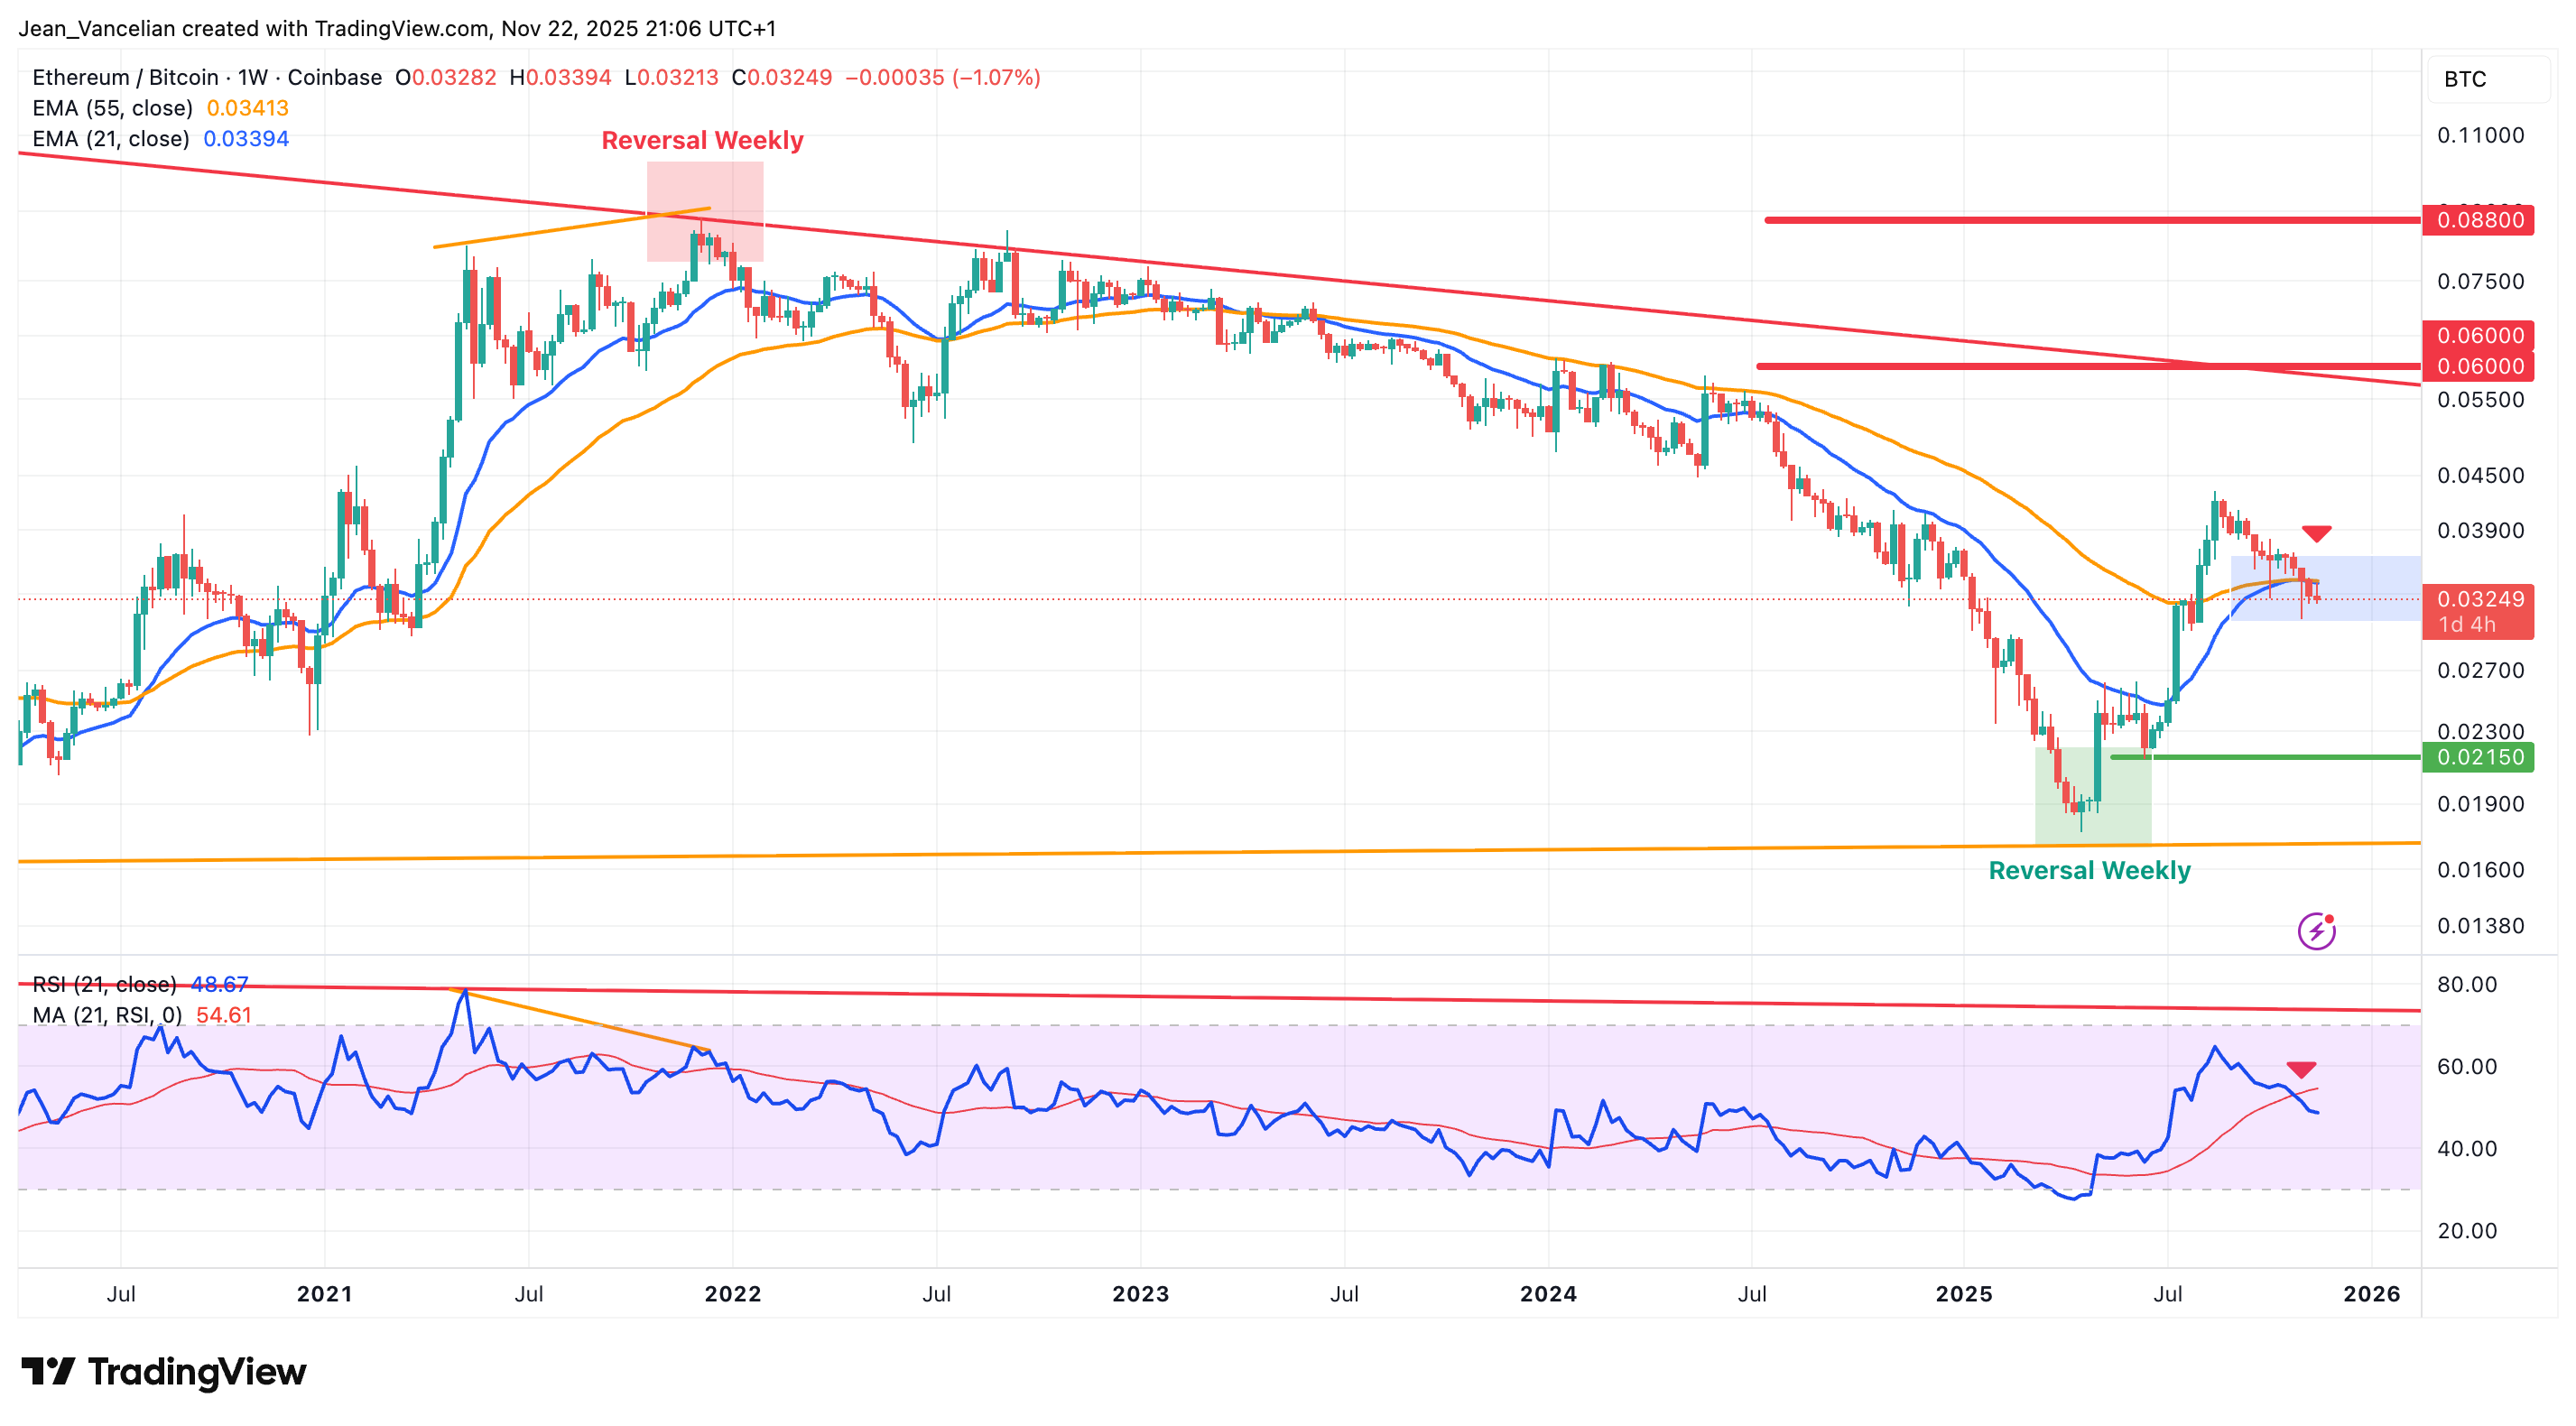
At the same time, Ethereum has recently decoupled from Bitcoin in terms of relative performance and volatility. This divergence raises concerns about the current liquidity conditions within the crypto market, particularly for assets outside of Bitcoin that rely more heavily on speculative flows.
Earlier in the year, Ethereum’s bullish structure was still broadly aligned with Bitcoin’s long-term pattern, despite evolving within a complex and uncertain range. However, the latest downward swing now points toward a broader and more prolonged sideways market, with a low probability of an impulsive bullish breakout in the near term.
In other words, the technical picture has turned complex, fragile and less directional, especially when compared to other risk-on assets. This shift calls for heightened caution on Ethereum at current price levels.
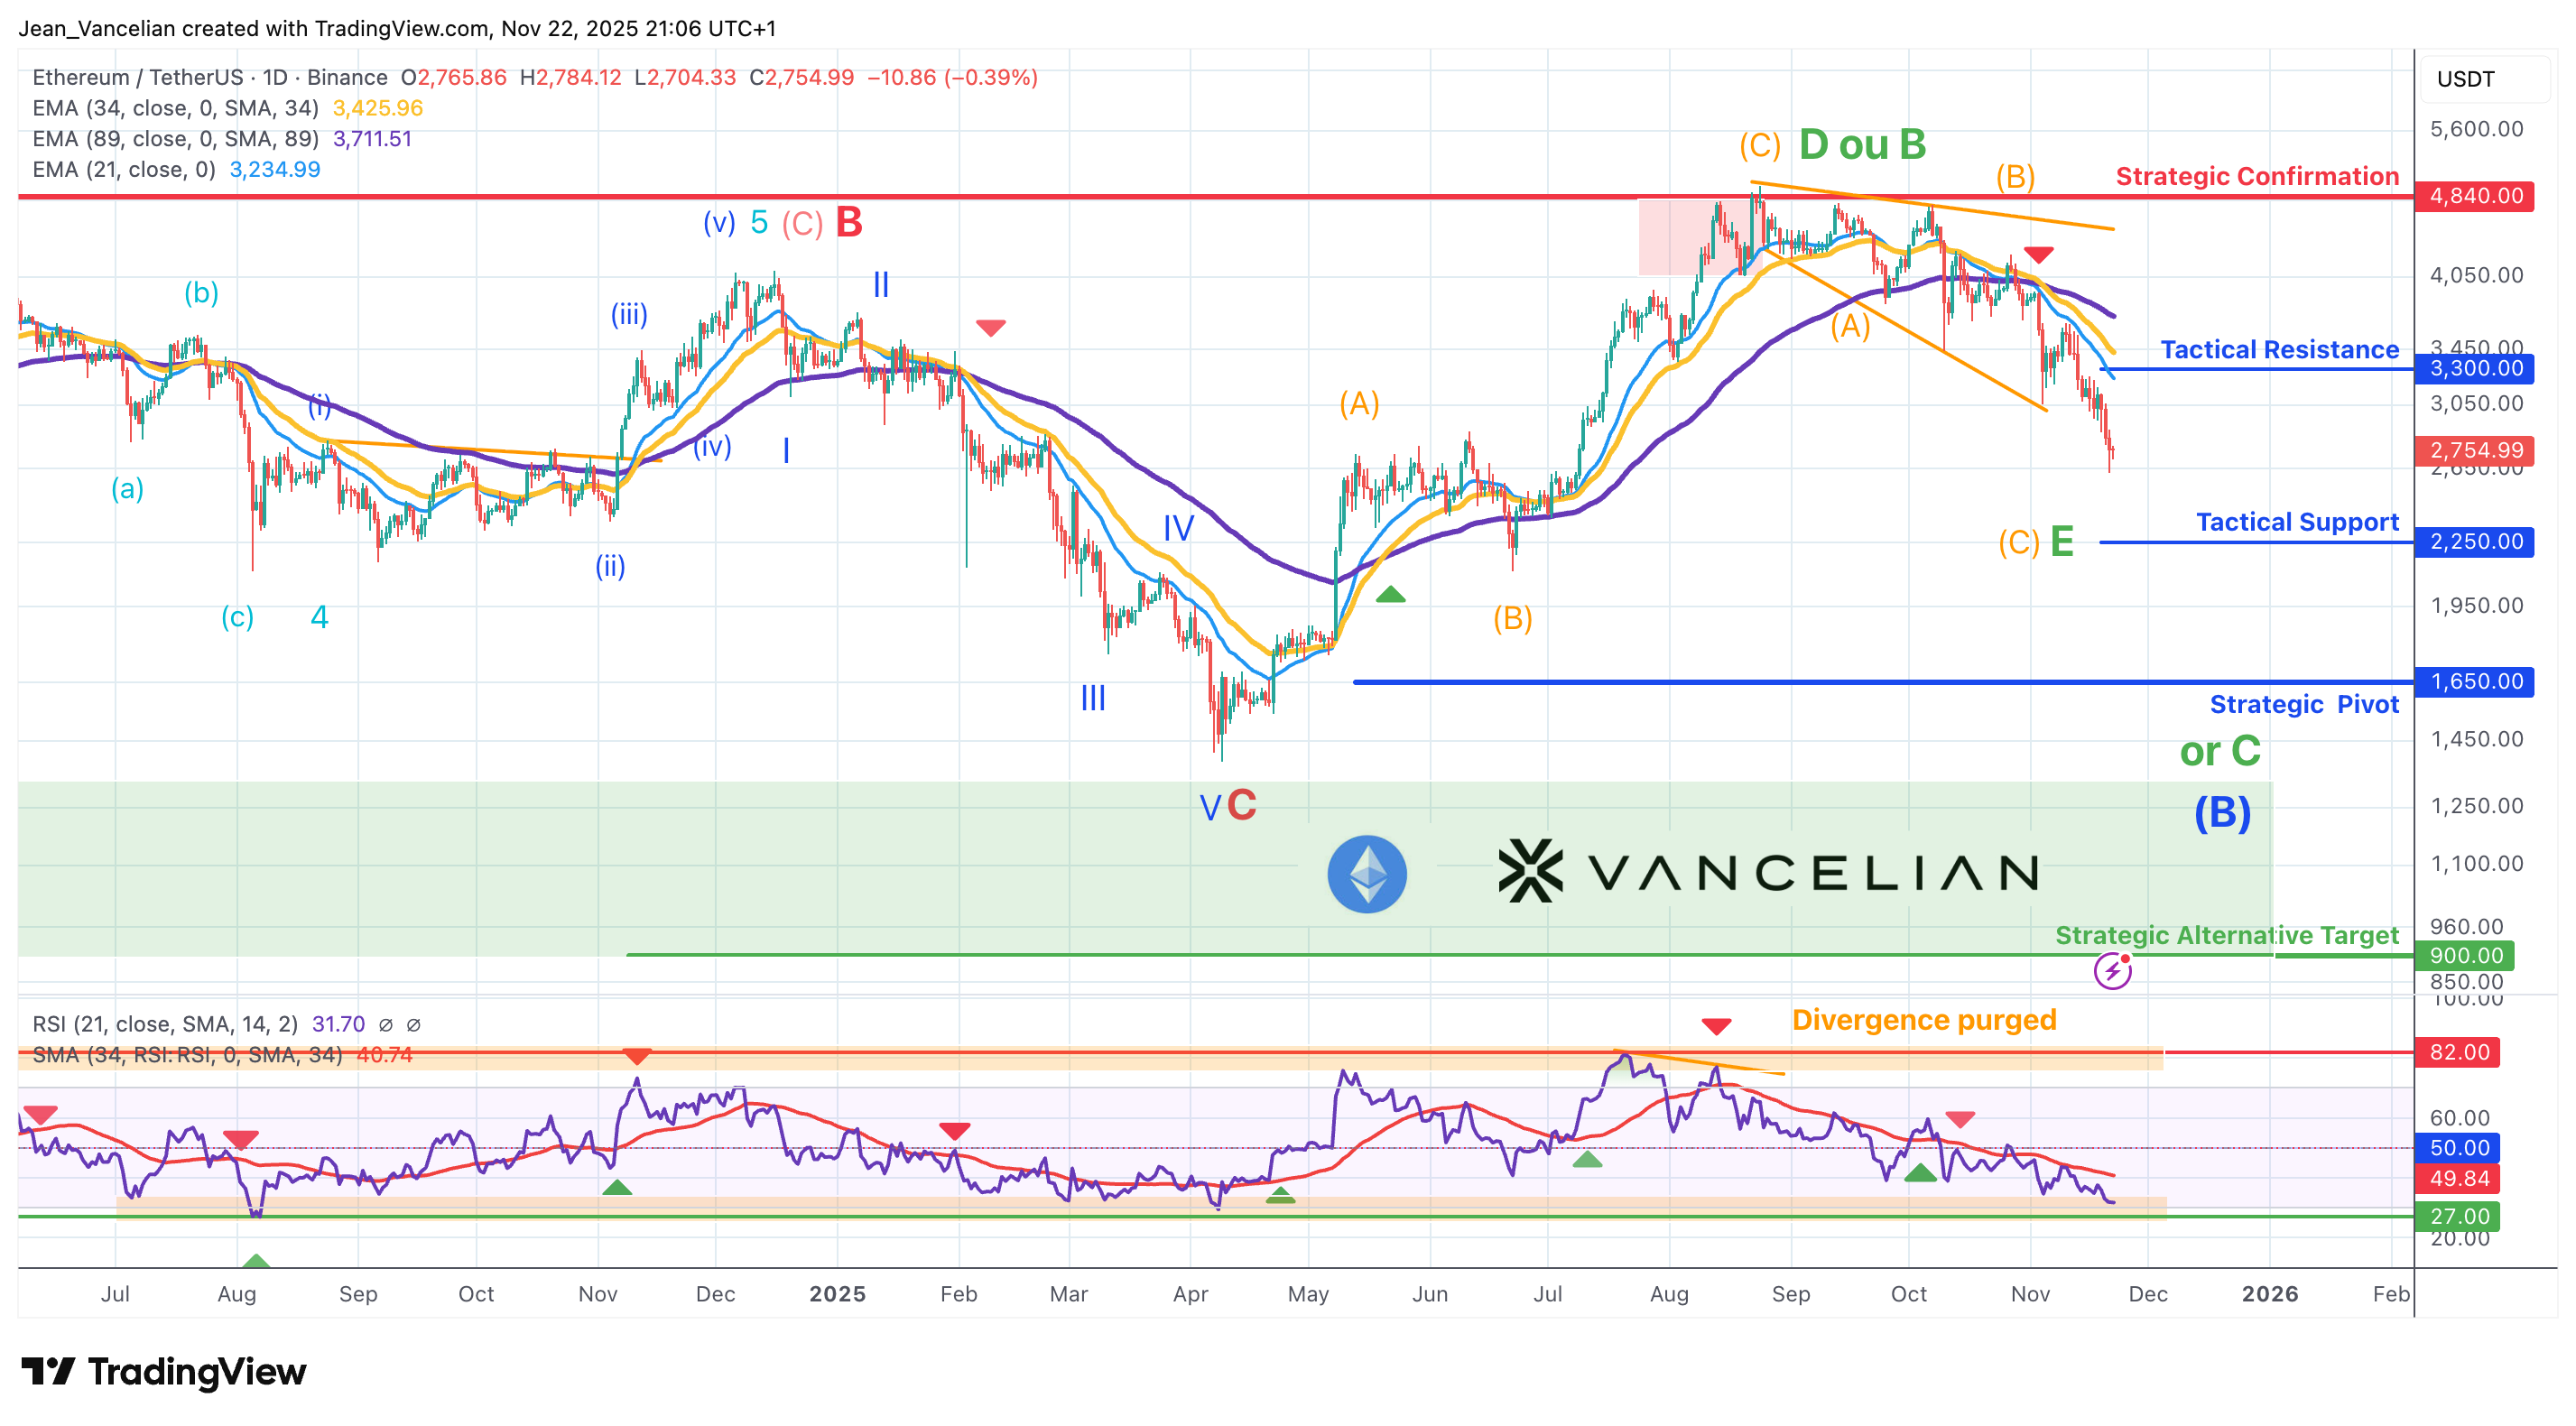
Caution : The strategic key level for Ethereum has been revised to 1,650 $, a substantial adjustment when compared with Bitcoin’s equivalent long-term level at 72,000 $. This downgrade reflects both the increased risk of completing a broader sideways structure within the current complex Elliott Wave scenario, and the renewed structural underperformance trend of ETH/BTC, which has resumed after Ethereum fell back below its 55-week EMA.
Tactical Horizon Analysis (1 to 3 months)
Ethereum is currently trading around 2,740 $, which is below the first alternative tactical target set at 3,300 $, after failing to recover above the smart DCA zone previously defined at 3,900 $ earlier in October.
With the RSI 21 anchored in negative territory and showing no bullish divergence, and with the Daily EMA continuing to cap the current downtrend, the technical picture remains clearly bearish. This setup is fully aligned with the alternative scenario now in progress, following the invalidation of the former tactical key support at 3,900 $.
At current levels, and in the absence of any pre-signal—such as a bullish divergence on RSI, a reversal structure on price, or a sharp invalidation of the decline through a recovery above the 34-day moving average—the most probable outcome is the development of a complex downside sideways structure. This would open the way toward a test of the major Fibonacci levels at 2,250 $, and potentially 1,650 $ in extension, which corresponds to the updated Strategic Key Pivot on the higher time horizon.
Scenario in progress: As long as 3,400 $ continues to cap the trend, a consolidation followed by a test of 2,250 $ remains the most likely scenario before any meaningful update of the dynamic technical outlook can occur.
No tactical trade recommendations are issued at this stage, given the elevated volatility, the lack of a reliable technical setup, and an unfavourable risk-reward configuration.
Chart: Daily Basis (Candle Stick) - Logarithmic
Indicators: Exponential Moving average (21/34/89) - RSI (21)
Disclaimer: The content of this analysis should not be considered as a study, an investment advice or a recommendation concerning products, strategies or a particular investment opportunity. This content is strictly for illustrative, educational or informational purposes and is subject to change. Investors should not base their investment decision on the content of this site and are strongly recommended to seek independent financial advice for any investment they are considering.