Strategic Bullish Trend Intact as Tactical Correction Extends Toward $101,000 and $94,000
Bitcoin (BTC/USDC)
Date of Analysis: October 17, 2025
Chart Timeframe: Daily
Strategic Horizon Analysis (6 to 12 months):
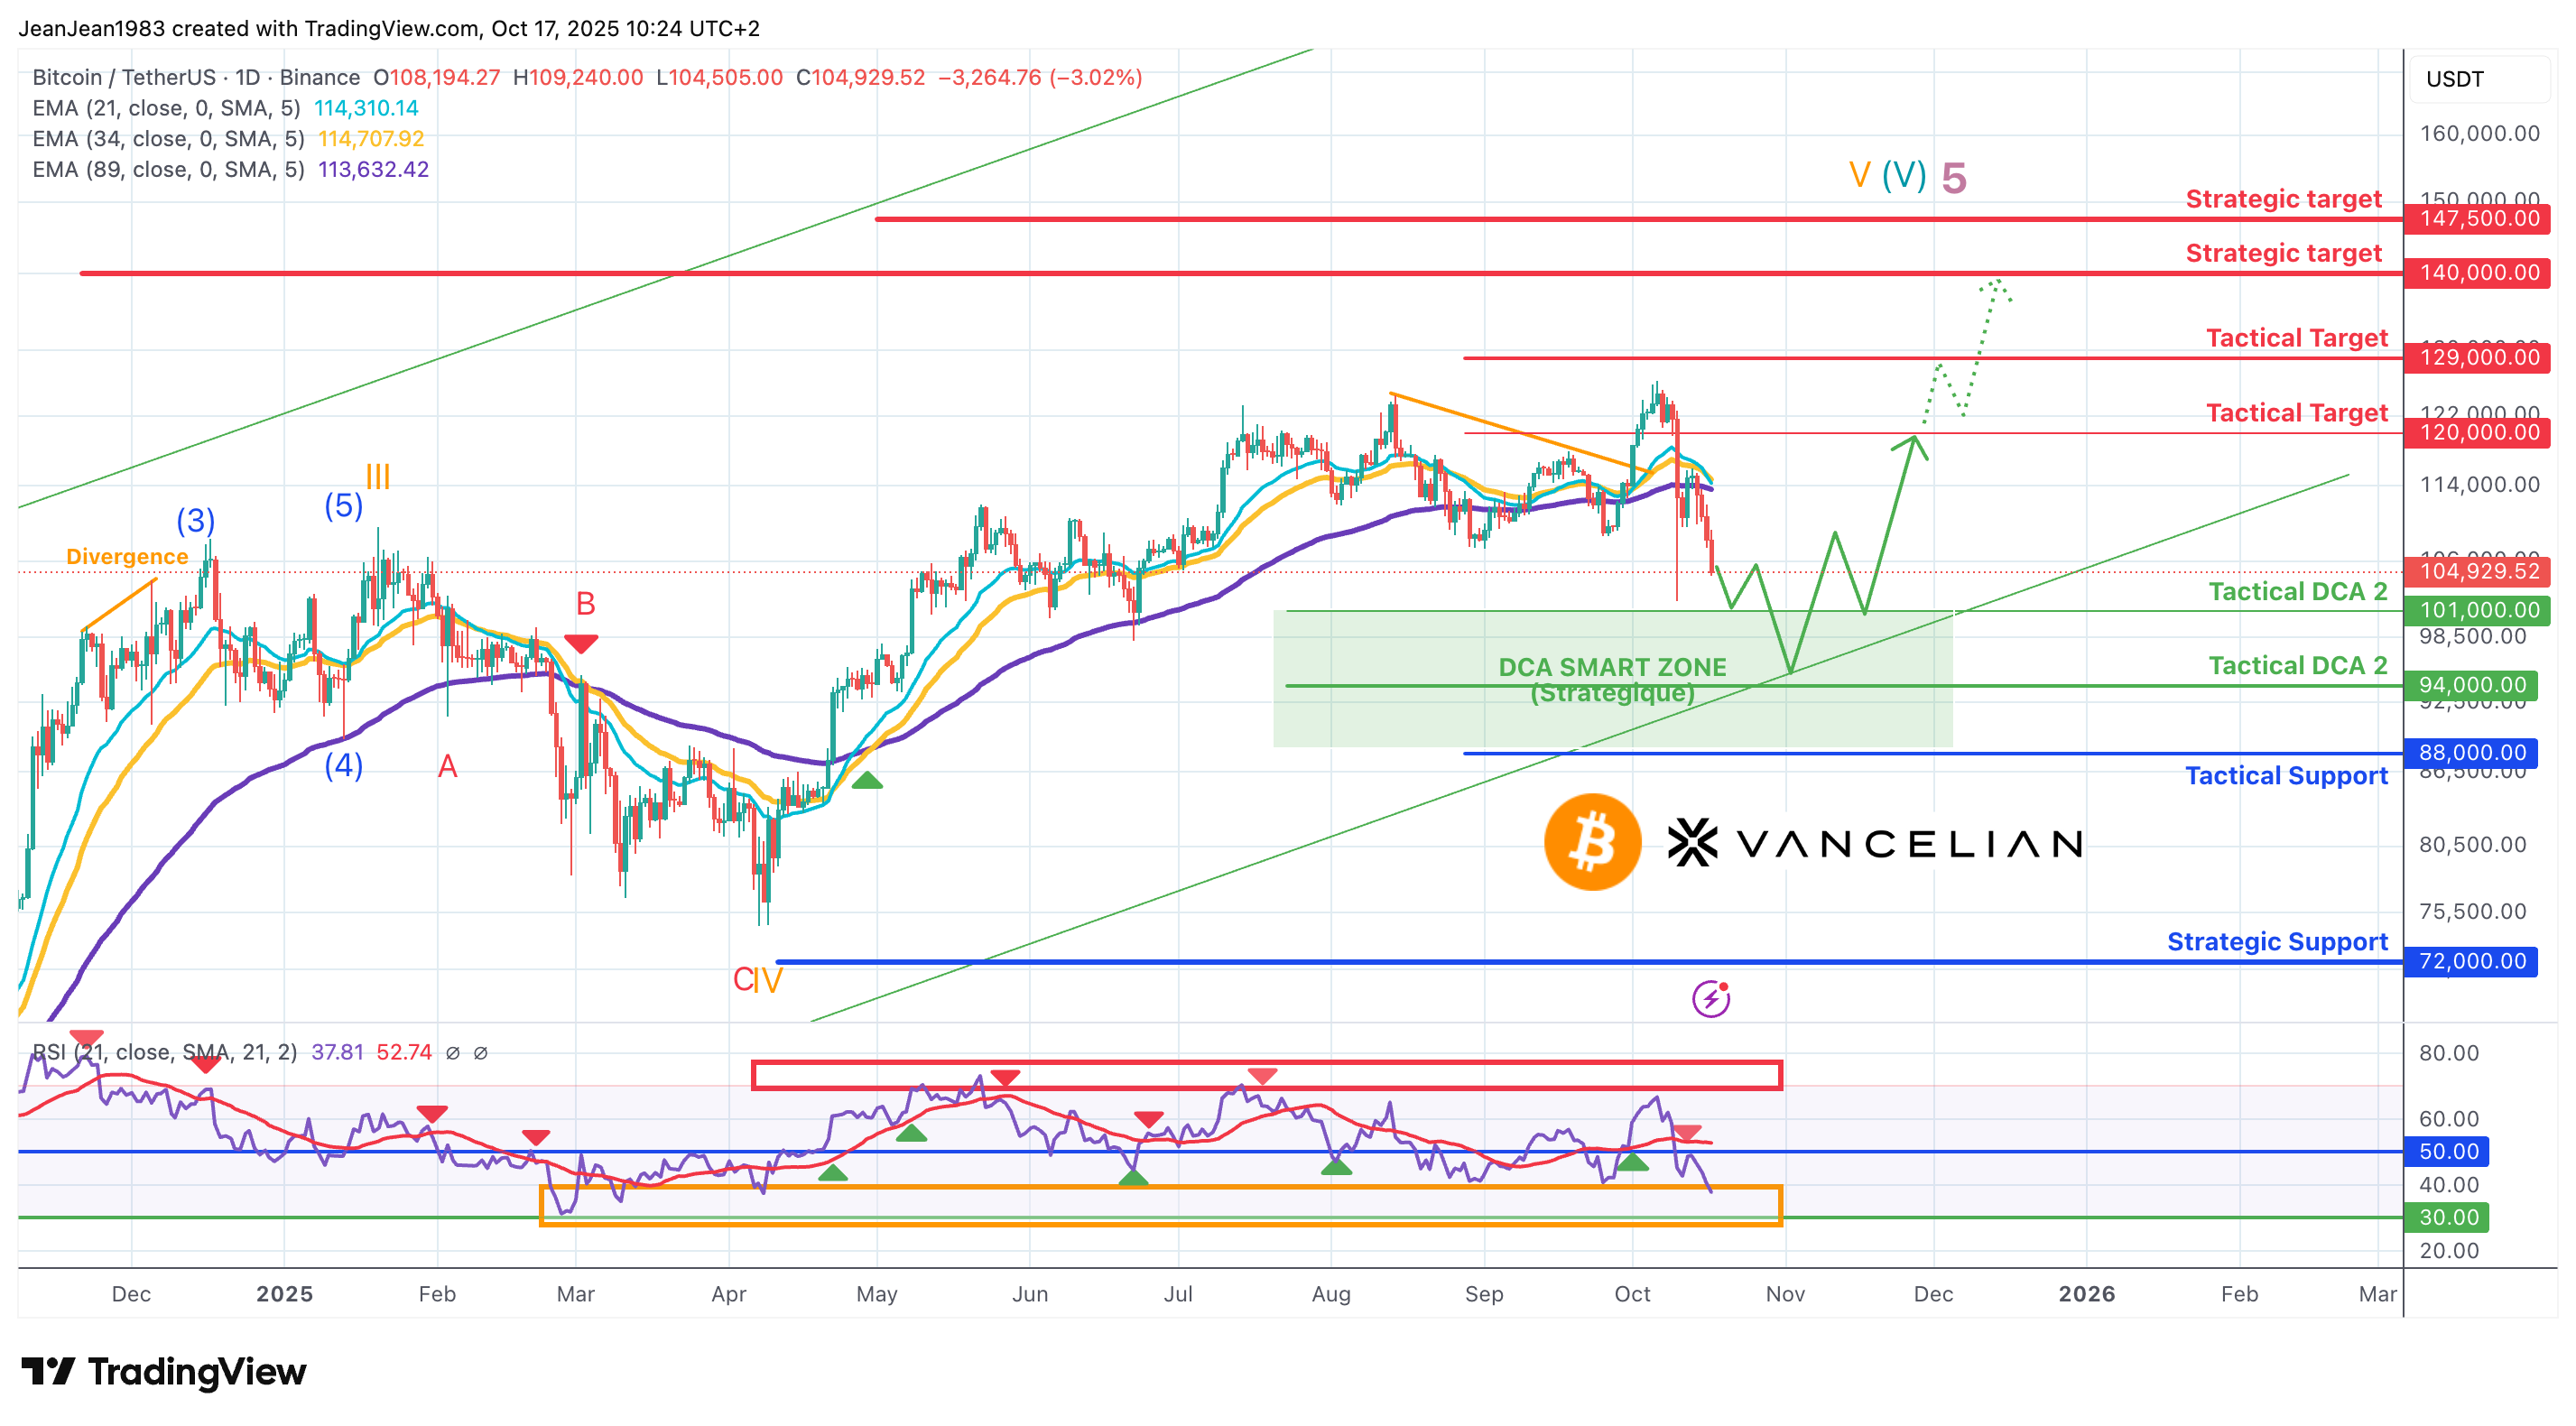
Bitcoin remains within its long-term Strategic Bullish Channel, supported by higher lows since 2023. The macro Elliott structure suggests a Wave (V) advance is underway, with the current move representing a corrective sub-wave (4)before a renewed bullish impulsive rally.
The Strategic Targets are projected at $140,000 and $147,500, aligning with the upper boundary of the long-term ascending channel.
The Strategic Support Zone around $72,000–$75,000 remains the foundation for the multi-month uptrend continuation into 2026.
Key Observation:

The dominance of Bitcoin has surged to 64% prior to 63,1% in May 2025 (11/07/2025 - source coinmarketcap) of the total crypto market capitalization since November 2024, marking its highest level since 2021. This confirms Bitcoin’s outperformance relative to the broader crypto market, a trend that remains strongly active and further reinforces long-term bullish sentiment.
Caution: On the Short-term ETH is showing new sign of weekness after having outperform the last past 4 month signaling a global active altseason underperformance
Alternative Tactical Scenario in progress (1 to 3 months)
BTC is undergoing a confirmed tactical correction after losing key support at the EMA cluster (21/34/89) at $111 000
Price action is about to test the upper limit of the “DCA Strategic Smart Zone”, which aligns with the confluence of Fibonacci retracement and the lower boundary of the medium-term ascending channel.
The RSI (38) confirms continued bearish momentum but shows early signs of potential bullish divergence formation near oversold territory (30–40 range).
Short-term, BTC could continue a choppy consolidation toward $101,000 before $94,000 before resuming its Wave (5)rally targeting $120,000–$140,000.
Technical Key Elements
- Current Price: $105,326 (October 17)
- Tactical Resistance: $120,000 – $129,000
- Tactical Supports (DCA Zones): $101,000, $94,000
- Tactical Downside Extension = Tactical key support: $88,000
- RSI : Bearish below 50% - now divergence
- Moving average : resistance at $114,000
Tactical Trade Plan
Buy Strategy (Tactical Accumulation):
Initiate DCA entries within $101,000–$94,000, targeting a tactical rebound to $120,000–$129,000, and a strategic extension toward $140,000+.
Stop-Loss: Daily close below $88,000 (Tactical Support).
Chart: Daily Basis (Candle Stick) - Logarithmic
Indicators: Exponential Moving Average (21/34/89) - RSI (21)
Disclaimer: The content of this analysis should not be considered as a study, an investment advice or a recommendation concerning products, strategies or a particular investment opportunity. This content is strictly for illustrative, educational or informational purposes and is subject to change. Investors should not base their investment decision on the content of this site and are strongly recommended to seek independent financial advice for any investment they are considering.