Aktio (AKTIO/USDC) Approaching Tactical Breakout at $0.1420
Chart Timeframe: 1D (Daily)
Strategic Horizon Analysis (6 to 12 months)
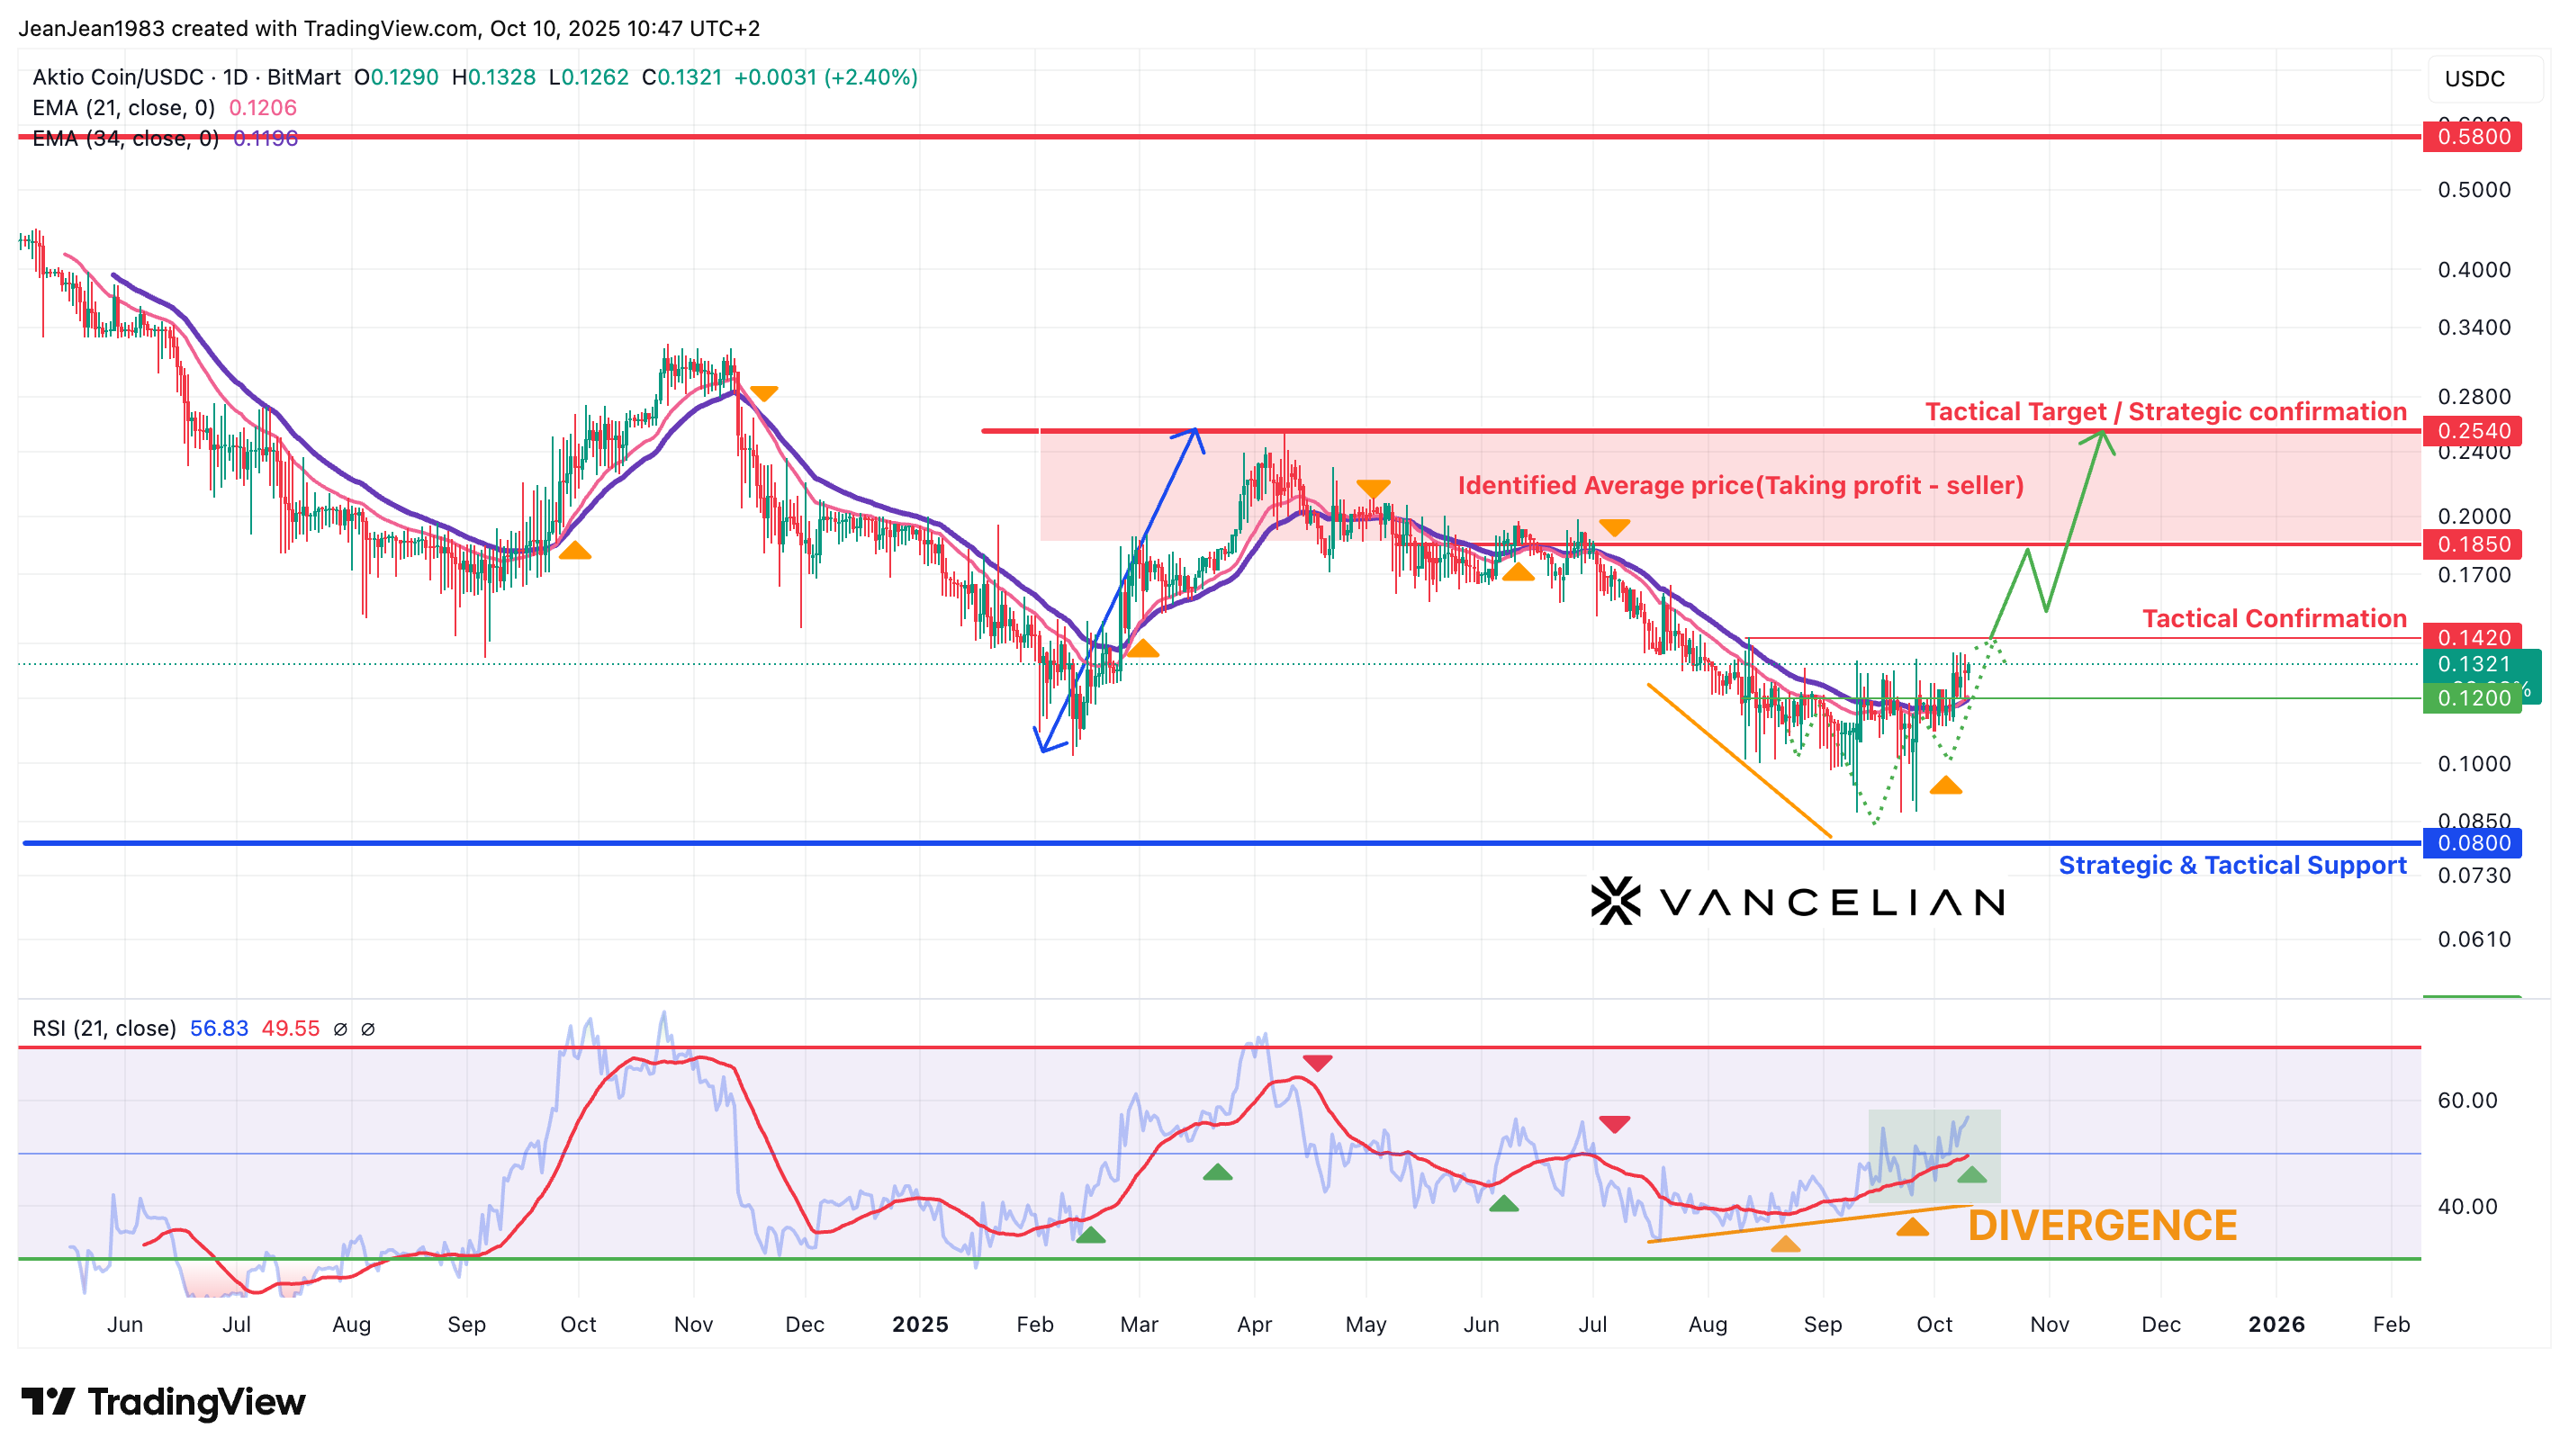
Aktio Coin remains within a strategic accumulation phase following an extended bearish cycle that bottomed around the Strategic & Tactical Support zone near $0.0800.
Recent signals, including a confirmed bullish RSI divergence and a bullish crossover between EMA 21 and EMA 34, mark the early stages of a potential major structural reversal.
The Strategic Target Zone lies near $0.2540, aligning with the previous major resistance area and the identified average selling price region.
A sustained breakout and daily close above $0.2540 would confirm the start of a new strategic bullish cycle, potentially extending toward $0.5800 over the next 6–12 months.
Tactical Horizon Analysis (1 to 3 months)
Aktio is currently trading around $0.1320, approaching the Tactical Confirmation level at $0.1420, which remains the critical breakout point to validate a bullish continuation.
As long as the price has not closed above $0.1420 (daily timeframe), the tactical recovery remains in its building phase.
A daily close above $0.1420 would confirm a bullish breakout, unlocking momentum toward the Tactical Target at $0.1850, followed by the Strategic Confirmation zone at $0.2540.
Short-term moving averages (EMA 21 & EMA 34) have now crossed bullishly, supporting the ongoing recovery setup.
The RSI, currently around 56.8, continues to rise above the neutral 50 zone, indicating strengthening positive momentum.
Alternative Scenario
If Aktio fails to break above $0.1420 and instead falls below $0.1200, the price could retest the Strategic & Tactical Support zone between $0.0850 and $0.0800.
A confirmed daily close below $0.0800 would invalidate the reversal setup and reopen a prolonged consolidation scenario — which remains low probability at this stage given the improving technical backdrop.
![]()
Technical Analysis Summary
Element | Current Status |
RSI (21) | 56.8 – Bullish divergence confirmed, momentum improving |
EMA 21 / EMA 34 | Bullish crossover confirmed – early trend reversal |
Tactical Confirmation | $0.1420 (awaiting daily close above) |
Tactical Target | $0.1850 |
Strategic Confirmation / Target | $0.2540 |
Strategic & Tactical Support | $0.0800 |
Market Structure | Early-stage reversal after divergence; recovery in progress |
![]()
Tactical Trade Recommendations
Primary Buy Strategy (Awaiting Confirmation)
Entry Trigger: Daily close above $0.1420.
Targets: $0.1850 (first objective) → $0.2540 (strategic extension).
Suggested Stop-Loss: Below $0.0850 (daily close).
Alternative Sell Strategy (Defensive View)
If rejection occurs below $0.1420 and price breaks under $0.1200, expect retests of $0.0850 → $0.0800 as tactical reaccumulation zones.
Summary
Aktio (AKTIO/USDC) is showing early signs of a tactical bullish reversal after months of downside pressure.
The bullish RSI divergence, EMA 21/34 crossover, and stabilization above $0.1200 strengthen the case for an upcoming breakout.
The key signal remains a confirmed daily close above $0.1420, which would validate upward continuation toward $0.1850, and later $0.2540 as strategic confirmation.
Until that breakout occurs, Aktio remains in a reversal construction phase, with $0.0800 acting as the major long-term support and accumulation zone.
The content of this analysis should not be considered as a study, investment advice, or a recommendation regarding specific products, strategies, or investment opportunities. This content is strictly for illustrative, educational, or informational purposes and is subject to change. Investors should not base their investment decisions on the content of this site and are strongly advised to seek independent financial advice for any investment they are considering.