BTC progressing into a consolidation phase – $62,000 remains the key strategic support
Bitcoin (BTC/USDC)
Date of Analysis: February 9th 2026
Chart Timeframe: Daily
Strategic Scenario (6–12 months)
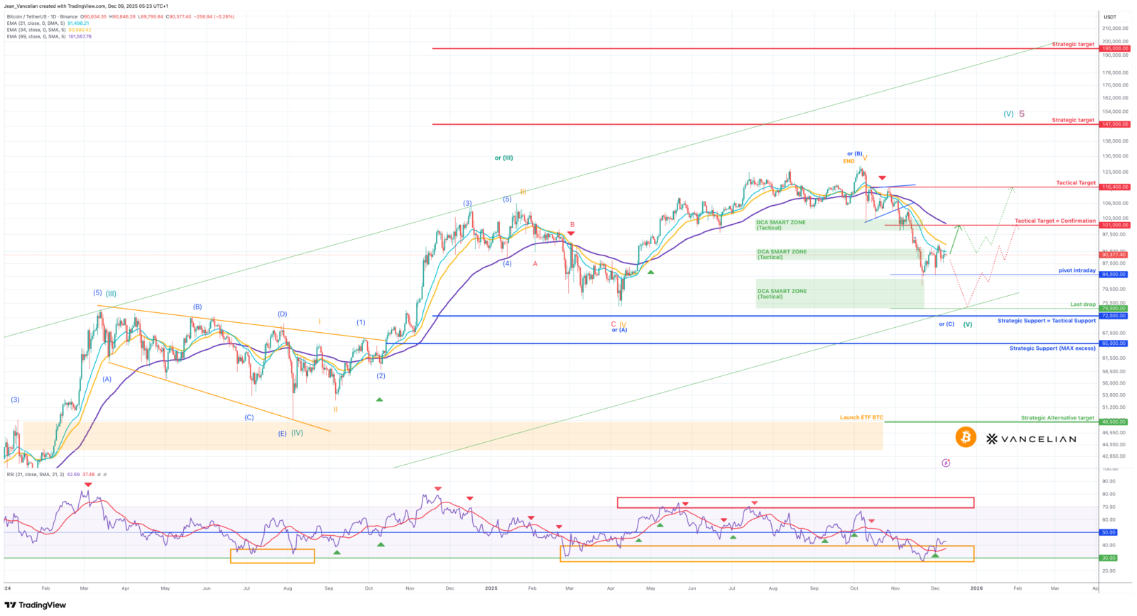
Bitcoin recently tested the $60,000 area without registering a weekly close below $62,000, which remains the key historical strategic support in our long-term framework. This price action confirms, for now, the resilience of the broader bullish structure despite elevated volatility.
The market is now entering a normalisation and consolidation phase, during which:
$62,000 must hold on a weekly closing basis,
and a swift recovery above $105,000 will be required to reactivate bullish momentum and reopen upside potential toward the $147,000 zone.
Macro and liquidity backdrop
The liquidity break observed in early October significantly weakened the crypto market and altered the macro narrative:
Bitcoin has decoupled from gold,
while also showing reduced correlation with the Nasdaq,
highlighting a broader loss of confidence in the crypto asset class.
This environment is compounded by a global liquidity contraction, as capital increasingly reallocates toward strategic and defensive assets.
The effect is further amplified by the unwinding of the JPY carry trade, as renewed rate hikes in Japan reduce the availability of cheap liquidity previously supporting risk assets.
BTC Dominance
This dynamic confirms Bitcoin’s continued outperformance relative to the broader crypto market—a trend driven by the fundamental singularity of the Bitcoin whitepaper and its ability to preserve a reserve-value function, thereby absorbing and retaining market liquidity.
As a result, we could see a significant underperformance of ETH and the TOP100. It is also worth noting that PAX Gold has a meaningful impact on dominance metrics; without it, Bitcoin dominance would likely be even higher.
|
|


Tactical Scenario in Progress (1 to 3 months)
Bitcoin finally capitulated in January, activating a stress phase and reaching the 65,000 / 62,000 strategic long-term area. This consolidation had been anticipated in our previous analysis, but it surprised the market by the speed and depth of the move.
Now, in line with the long-term trading plan, the tactical approach is to build long positions over the coming weeks and months, as long as 62,000 remains valid.
This is an opportune moment to do so, as the inflection point required to confirm a recovery and reduce downside risk is set at 79,900*. Once this level is reached, position management becomes significantly easier.
A daily breakout above 79,900 would materially reduce downside risk and open the way toward 95,200 and 105,000.
Conversely, a lack of momentum and liquidity could push Bitcoin lower. This scenario would be confirmed by a weekly close below 62,000, opening the 48,500 area—corresponding to the price zone where ETFs were launched earlier in 2024.
At this stage, technical signals remain skewed to the downside:
The RSI remains in negative territory but has reached peak downside momentum, positioning it to initiate a new bullish oscillation.
Moving averages have crossed downward and continue to accelerate lower, acting as resistance around 79,900.
The 79,900 area now acts as a strong dynamic resistance.
Chart: Daily Basis (Candle Stick) - Logarithmic
Indicators: Exponential Moving Average (21/34/89) - RSI (21)
