Ripple – Tactical rebound from the 1,150 strategic support
Ripple (XRP/USDC)
Date of Analysis: February 11, 2026
Chart Timeframe: Daily
Strategic Scenario (6 to 12 months)
Ripple has now completed a deep corrective leg within its broader post-cycle structure. The move toward the 1,150 area confirms a clear shift from trend continuation into cycle digestion, mirroring Bitcoin’s recent behavior and reflecting the lack of liquidity currently supporting the broader crypto market beyond BTC.
At this stage, Ripple is still positioned to resume an impulsive bullish trend. However, price action suggests the formation of a structural base, likely evolving into a medium-term sideways-to-recovery phase before providing a clear confirmation of trend impulsive move
Strategic Bias
Bullish-to-constructive, with downside risk now structurally reduced as long as 1,150 holds on a weekly closing basis.
Ripple may continue to benefit from a better liquidity absorbtion from the whole crypto market cap at this stage of the cycle.
Relative performance (XRP/BTC) : XRP/BTC relative performance remains Neutral The broader structure favors a sideways evolution with relative Neutral performance versus Bitcoin until at least summer 2026.
|
|

Tactical Horizon Analysis (1 to 3 months)
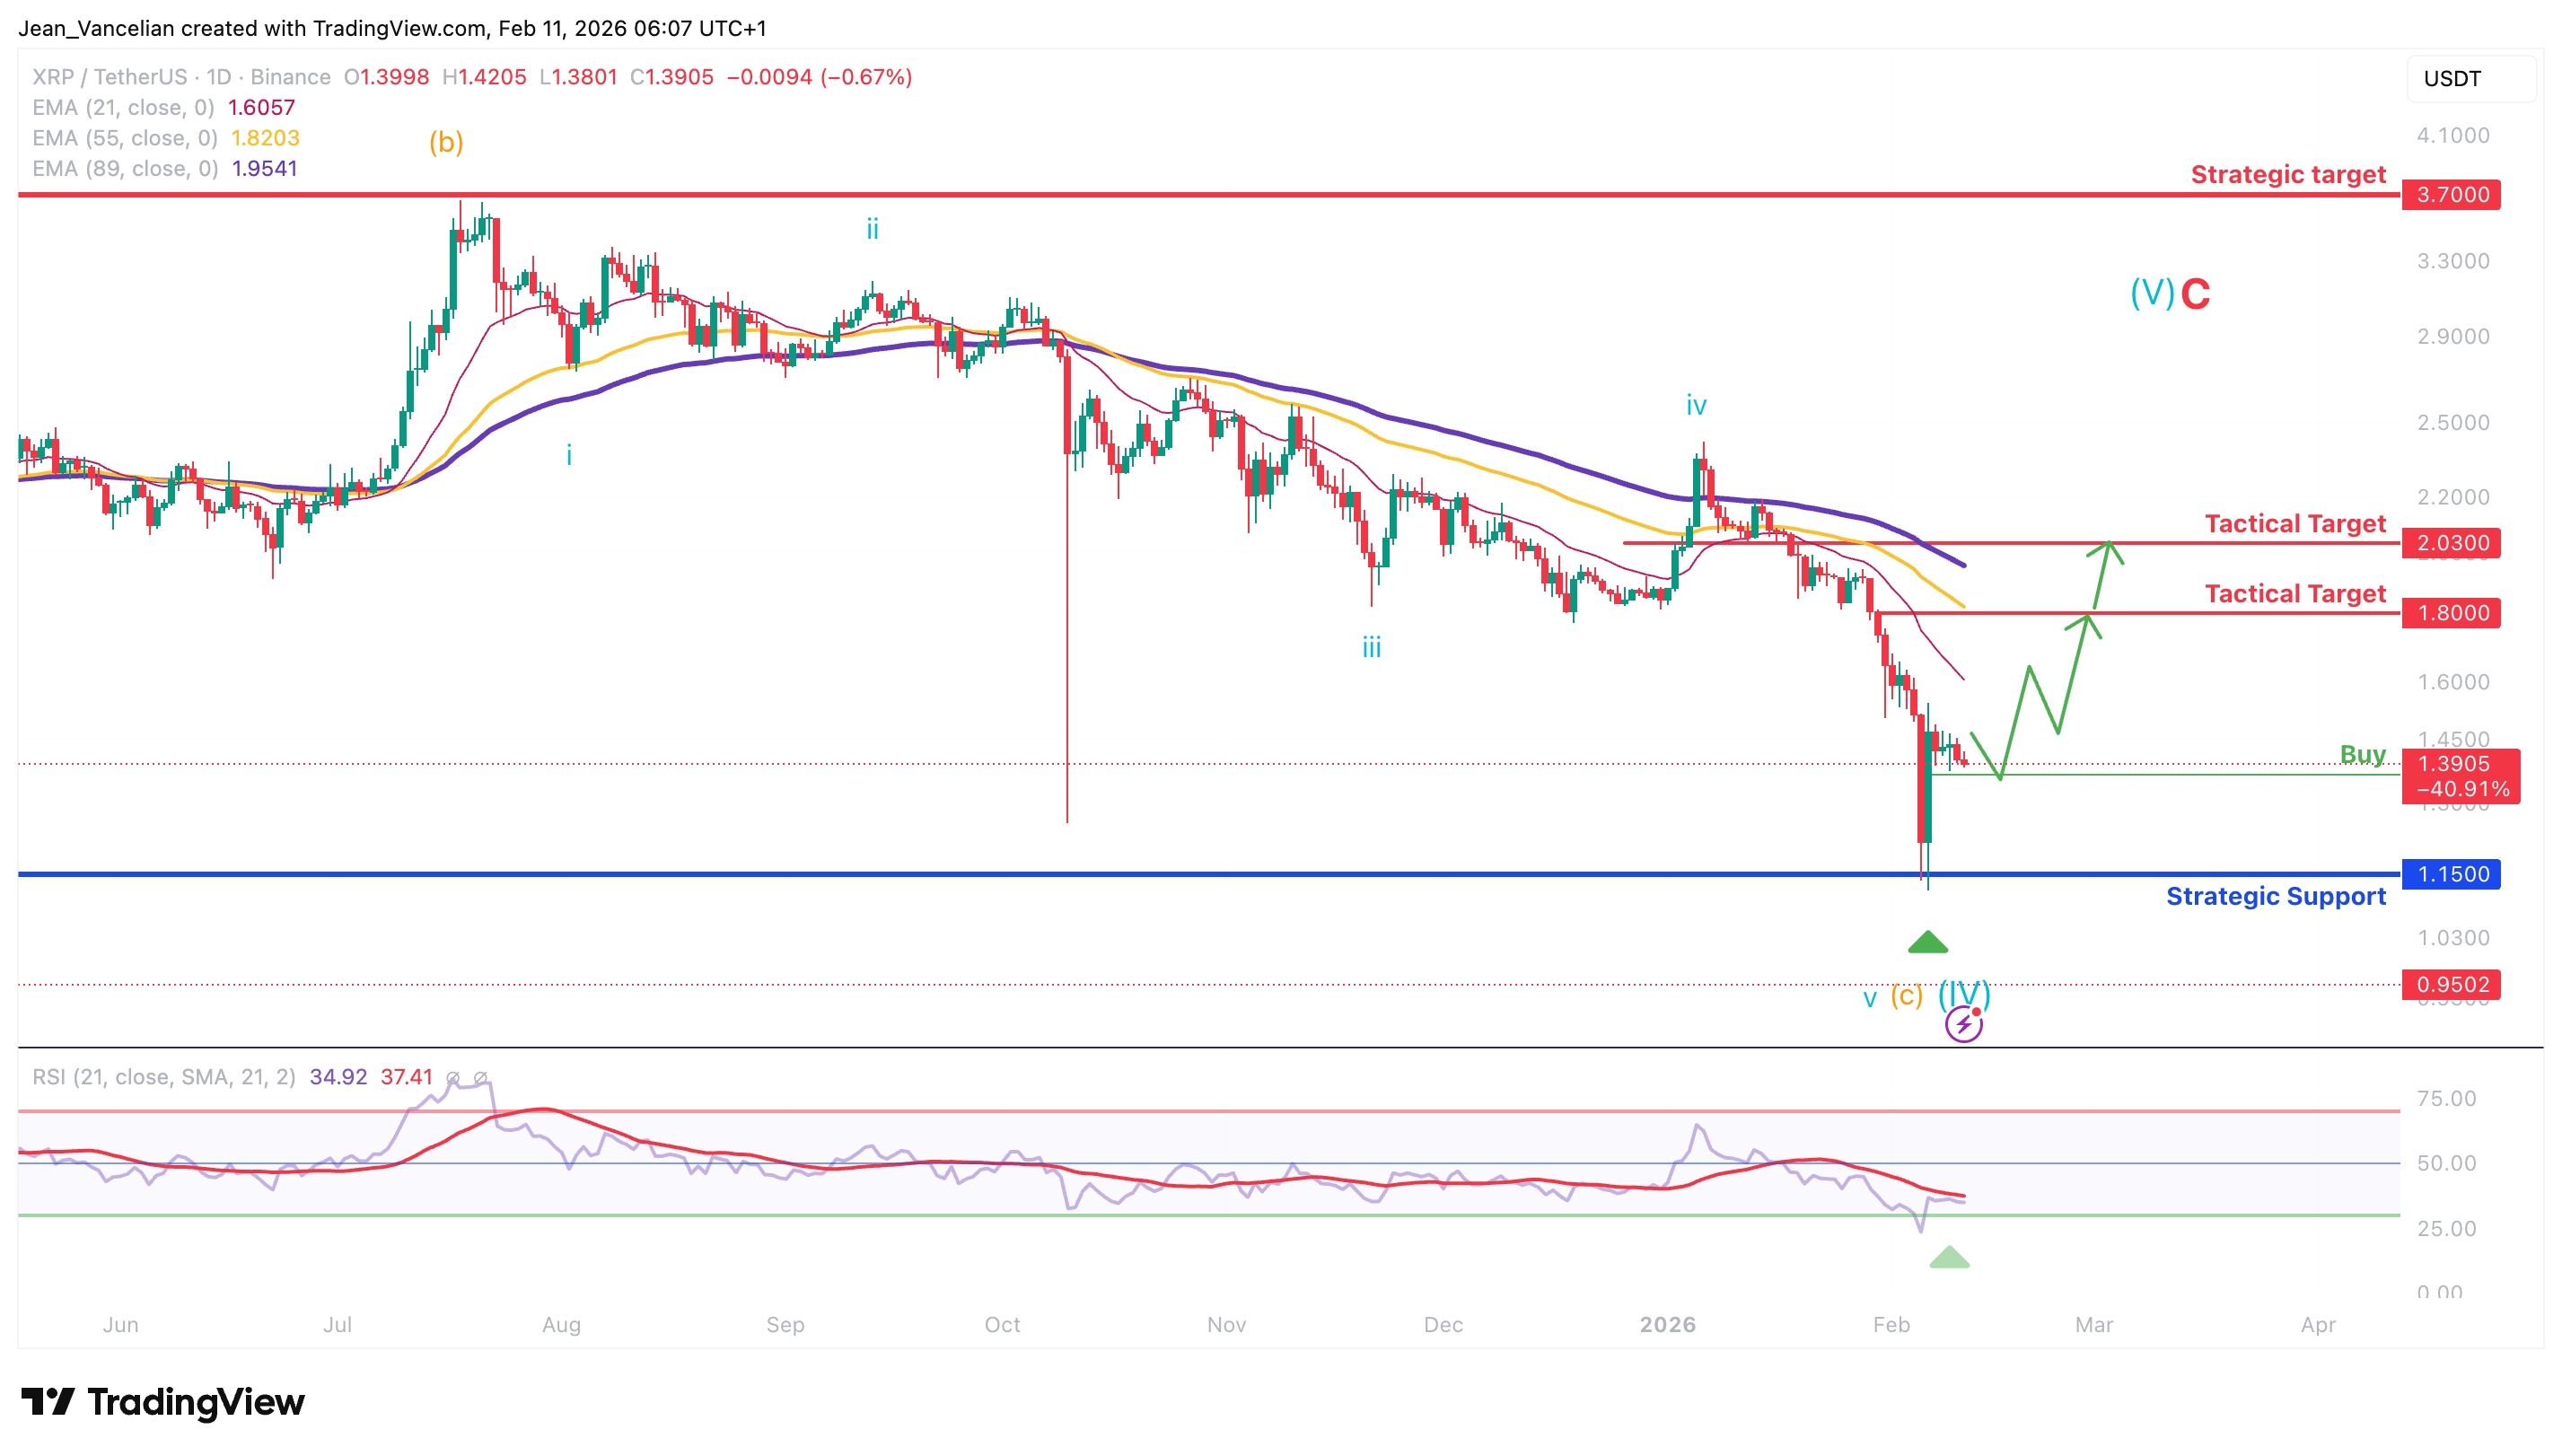
Since our previous analysis, downside pressure has intensified below the 3,70$ resistance, leading to a decisive break of the 1,70$ Tactical neutral support. Ripple subsequently entered a full corrective phase, reaching the 1,15 strategic support area.
This level represents a major higher-time-frame inflection point and marks the potential transition from a purely defensive posture toward a tactical recovery scenario, provided confirmation signals emerge
Ripple is now developing a tactical bullish setup from the 1,15 support, following a capitulation-style move and a clear loss of downside momentum.
While the medium-term trend remains technically bearish, the market is transitioning into a tactical opportunity phase, similar to Bitcoin’s current configuration. This phase represents the first step toward invalidating the bearish structure currently in progress.
Key technical observations:
The sharp decline toward 1,15 has exhausted selling pressure, increasing the probability of a rebound construction (RSI dynamics).
Moving average structures remain bearish, accelerating to the downside and currently acting as dynamic resistance around 1,80$.
The initial recovery phase is expected to be corrective and technical, a development in impulsive move have to be cconfirmed by a reintegration of 2,03$.
Tactical Levels
Standard Tactical Resistance: 2,03
First Tactical Resistance: 1,80
Entry Level: 1,40 (former structural support)
Invalidation (tactical): Weekly close below 1,15
A recovery above 2,03 would represent the first bullish validation, signaling that Ethereum is transitioning from pure correction into a recovery structure. Failure to reclaim this level would keep ETH trapped within a broader consolidation range.
Chart: Daily Basis (Candle Stick) - Logarithmic
Indicators: Exponential Moving average (21/34/89) - RSI (21)
Prefered scenario 
Alternative scenario
